1
2
3
4
5
6
7
8
9
10
11
12
13
14
15
16
17
18
19
20
21
22
23
24
25
26
27
28
29
30
31
32
33
34
35
36
37
38
39
40
41
42
43
44
45
46
47
48
49
50
51
52
53
54
55
56
|
clear all; close all;
Nvec=3:18;
L2_Err=[]; condnv=[];
for N=Nvec
[xv,wv]=legs(N+1);
Lm=lepolym(N,xv);
yv=1/2*(xv+1);
U=(1-yv).^2.*exp(yv)-1;
F=(2-4*yv).*exp(yv)-1;
e1=0:N-2; e2=0:N-3; e3=0:N-4;
S=diag( (4*e1+6).*(e1+1).^2./(e1+2).^2 );
M=diag(2./(2*e1+1)+2*(2*e1+3)./(e1+2).^4+2*((e1+1)./(e1+2)).^4./(2*e1+5))...
+diag( 2./(e2+2).^2-2*(e2+1).^2./((e2+2).^2.*(e2+3).^2) , 1 )...
+diag(2./(e2+2).^2-2*(e2+1).^2./((e2+2).^2.*(e2+3).^2),-1)...
+diag( -2*(e3+1).^2./((2*e3+5).*(e3+2).^2) , 2 )...
+diag(-2*(e3+1).^2./((2*e3+5).*(e3+2).^2),-2);
A=4*S+M;
Pm=(Lm(1:end-2,:)+diag((2*e1+3)./(e1+2).^2)...
*Lm(2:end-1,:)-diag((e1+1).^2./(e1+2).^2)*Lm(3:end,:));
b=Pm*diag(wv)*F;
Uh=A\b;
Un=Pm'*Uh;
L2_error=sqrt(((Un-U).^2)'*wv);
L2_Err=[L2_Err;L2_error];
condnv=[condnv,cond(A)];
end
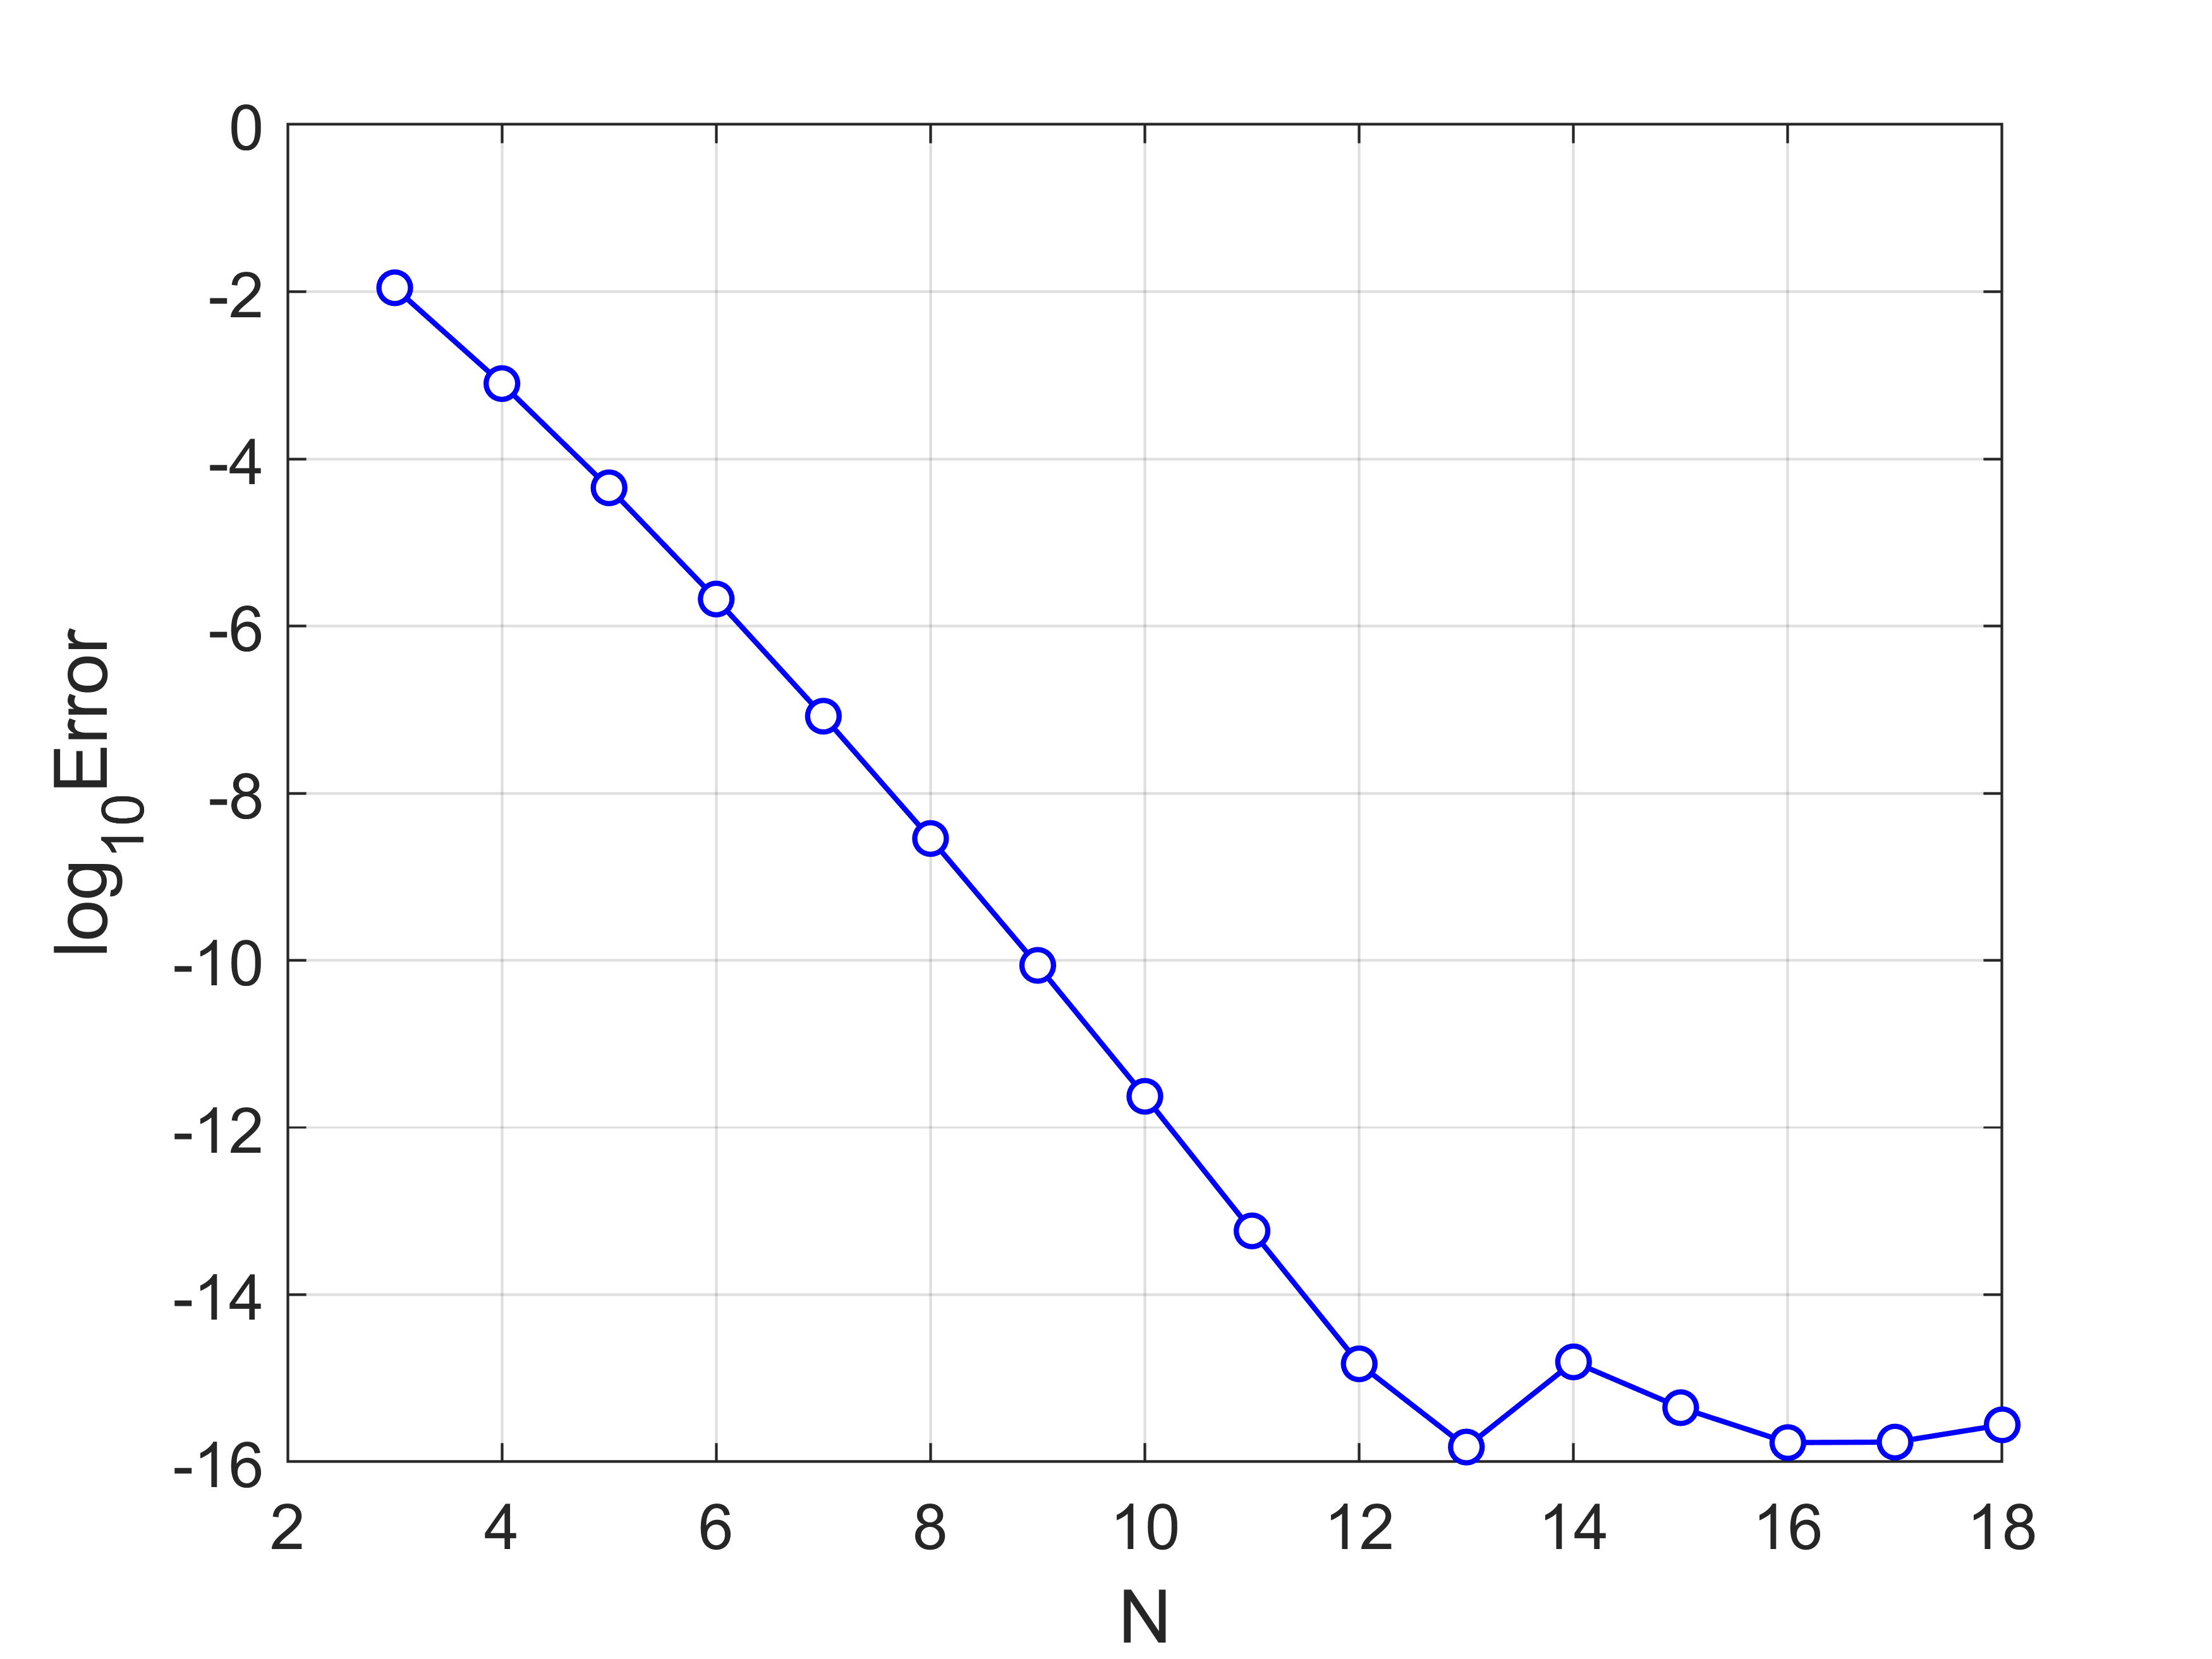
plot(Nvec,log10(L2_Err),'bo-','MarkerFaceColor','w','LineWidth',1)
grid on
set(gca,'fontsize',12)
xlabel('N','fontsize', 14), ylabel('log_{10}Error','fontsize',14)
xticks(2:2:18)
yticks(-16:2:0)
xlim([2 18])
ylim([-16 0])
|