1
2
3
4
5
6
7
8
9
10
11
12
13
14
15
16
17
18
19
20
21
22
23
24
25
26
27
28
29
30
31
32
33
34
35
36
37
38
39
40
41
42
43
44
45
46
47
48
49
50
51
|
clear all; close all;
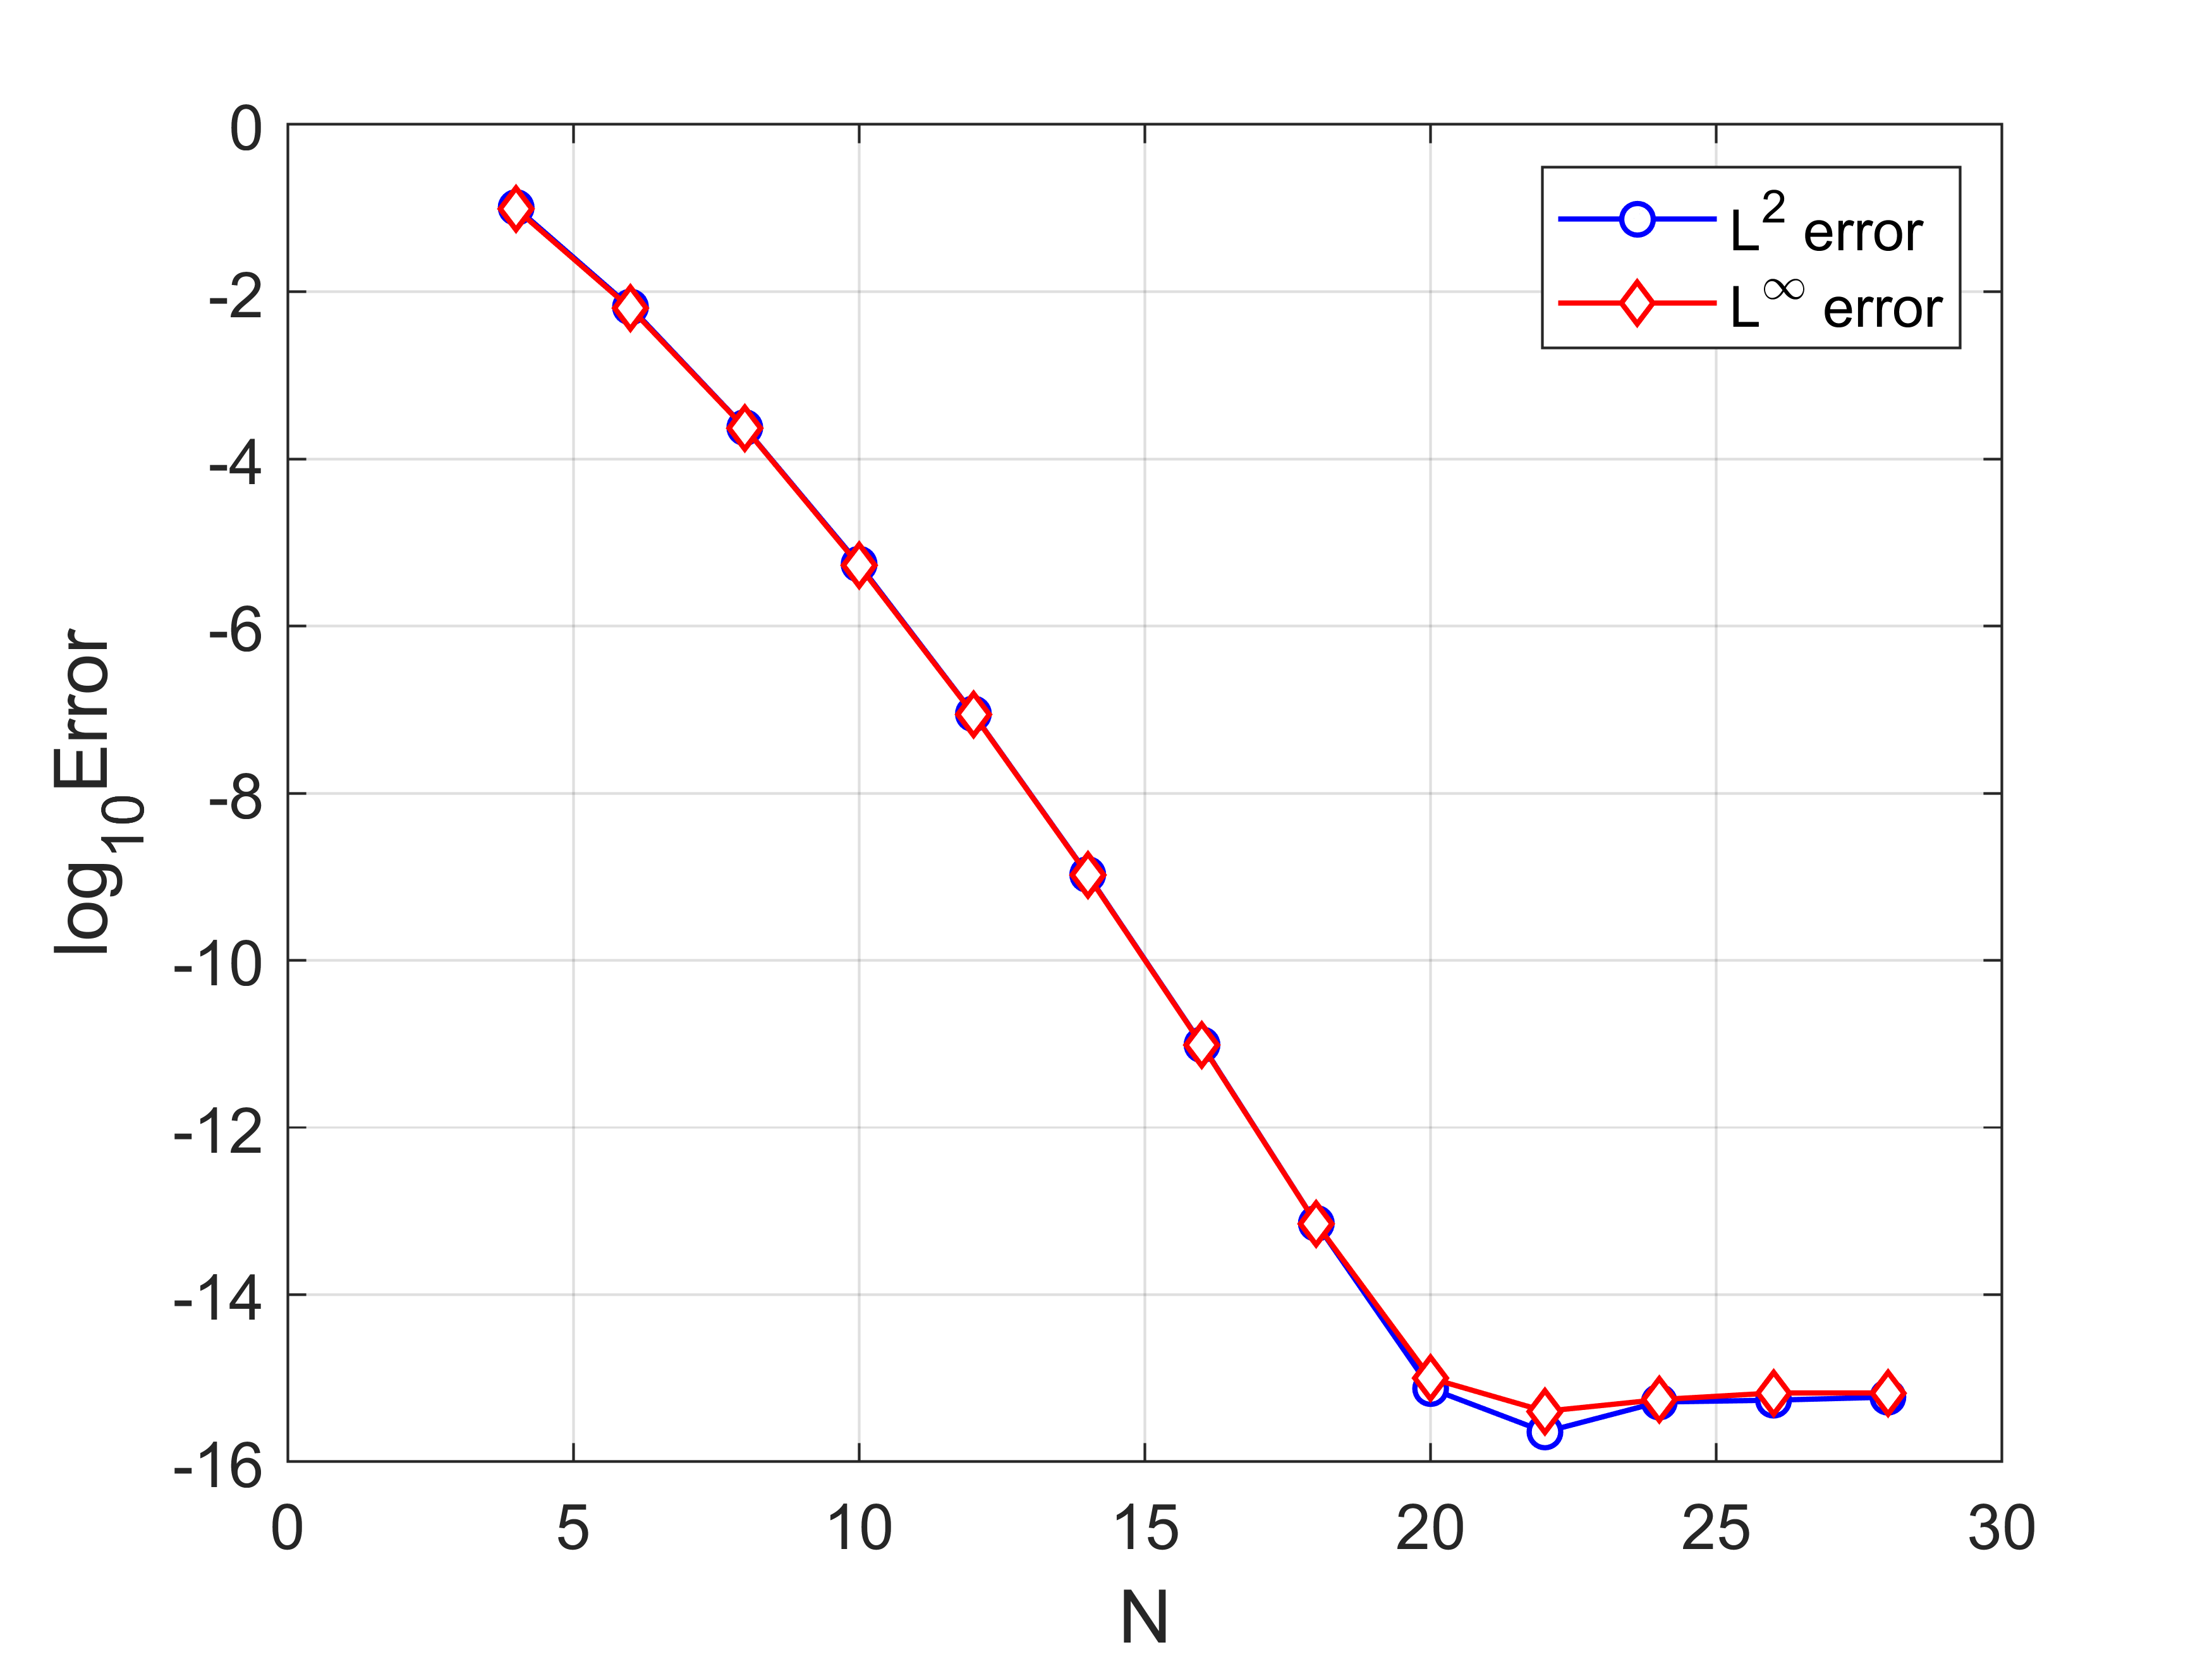
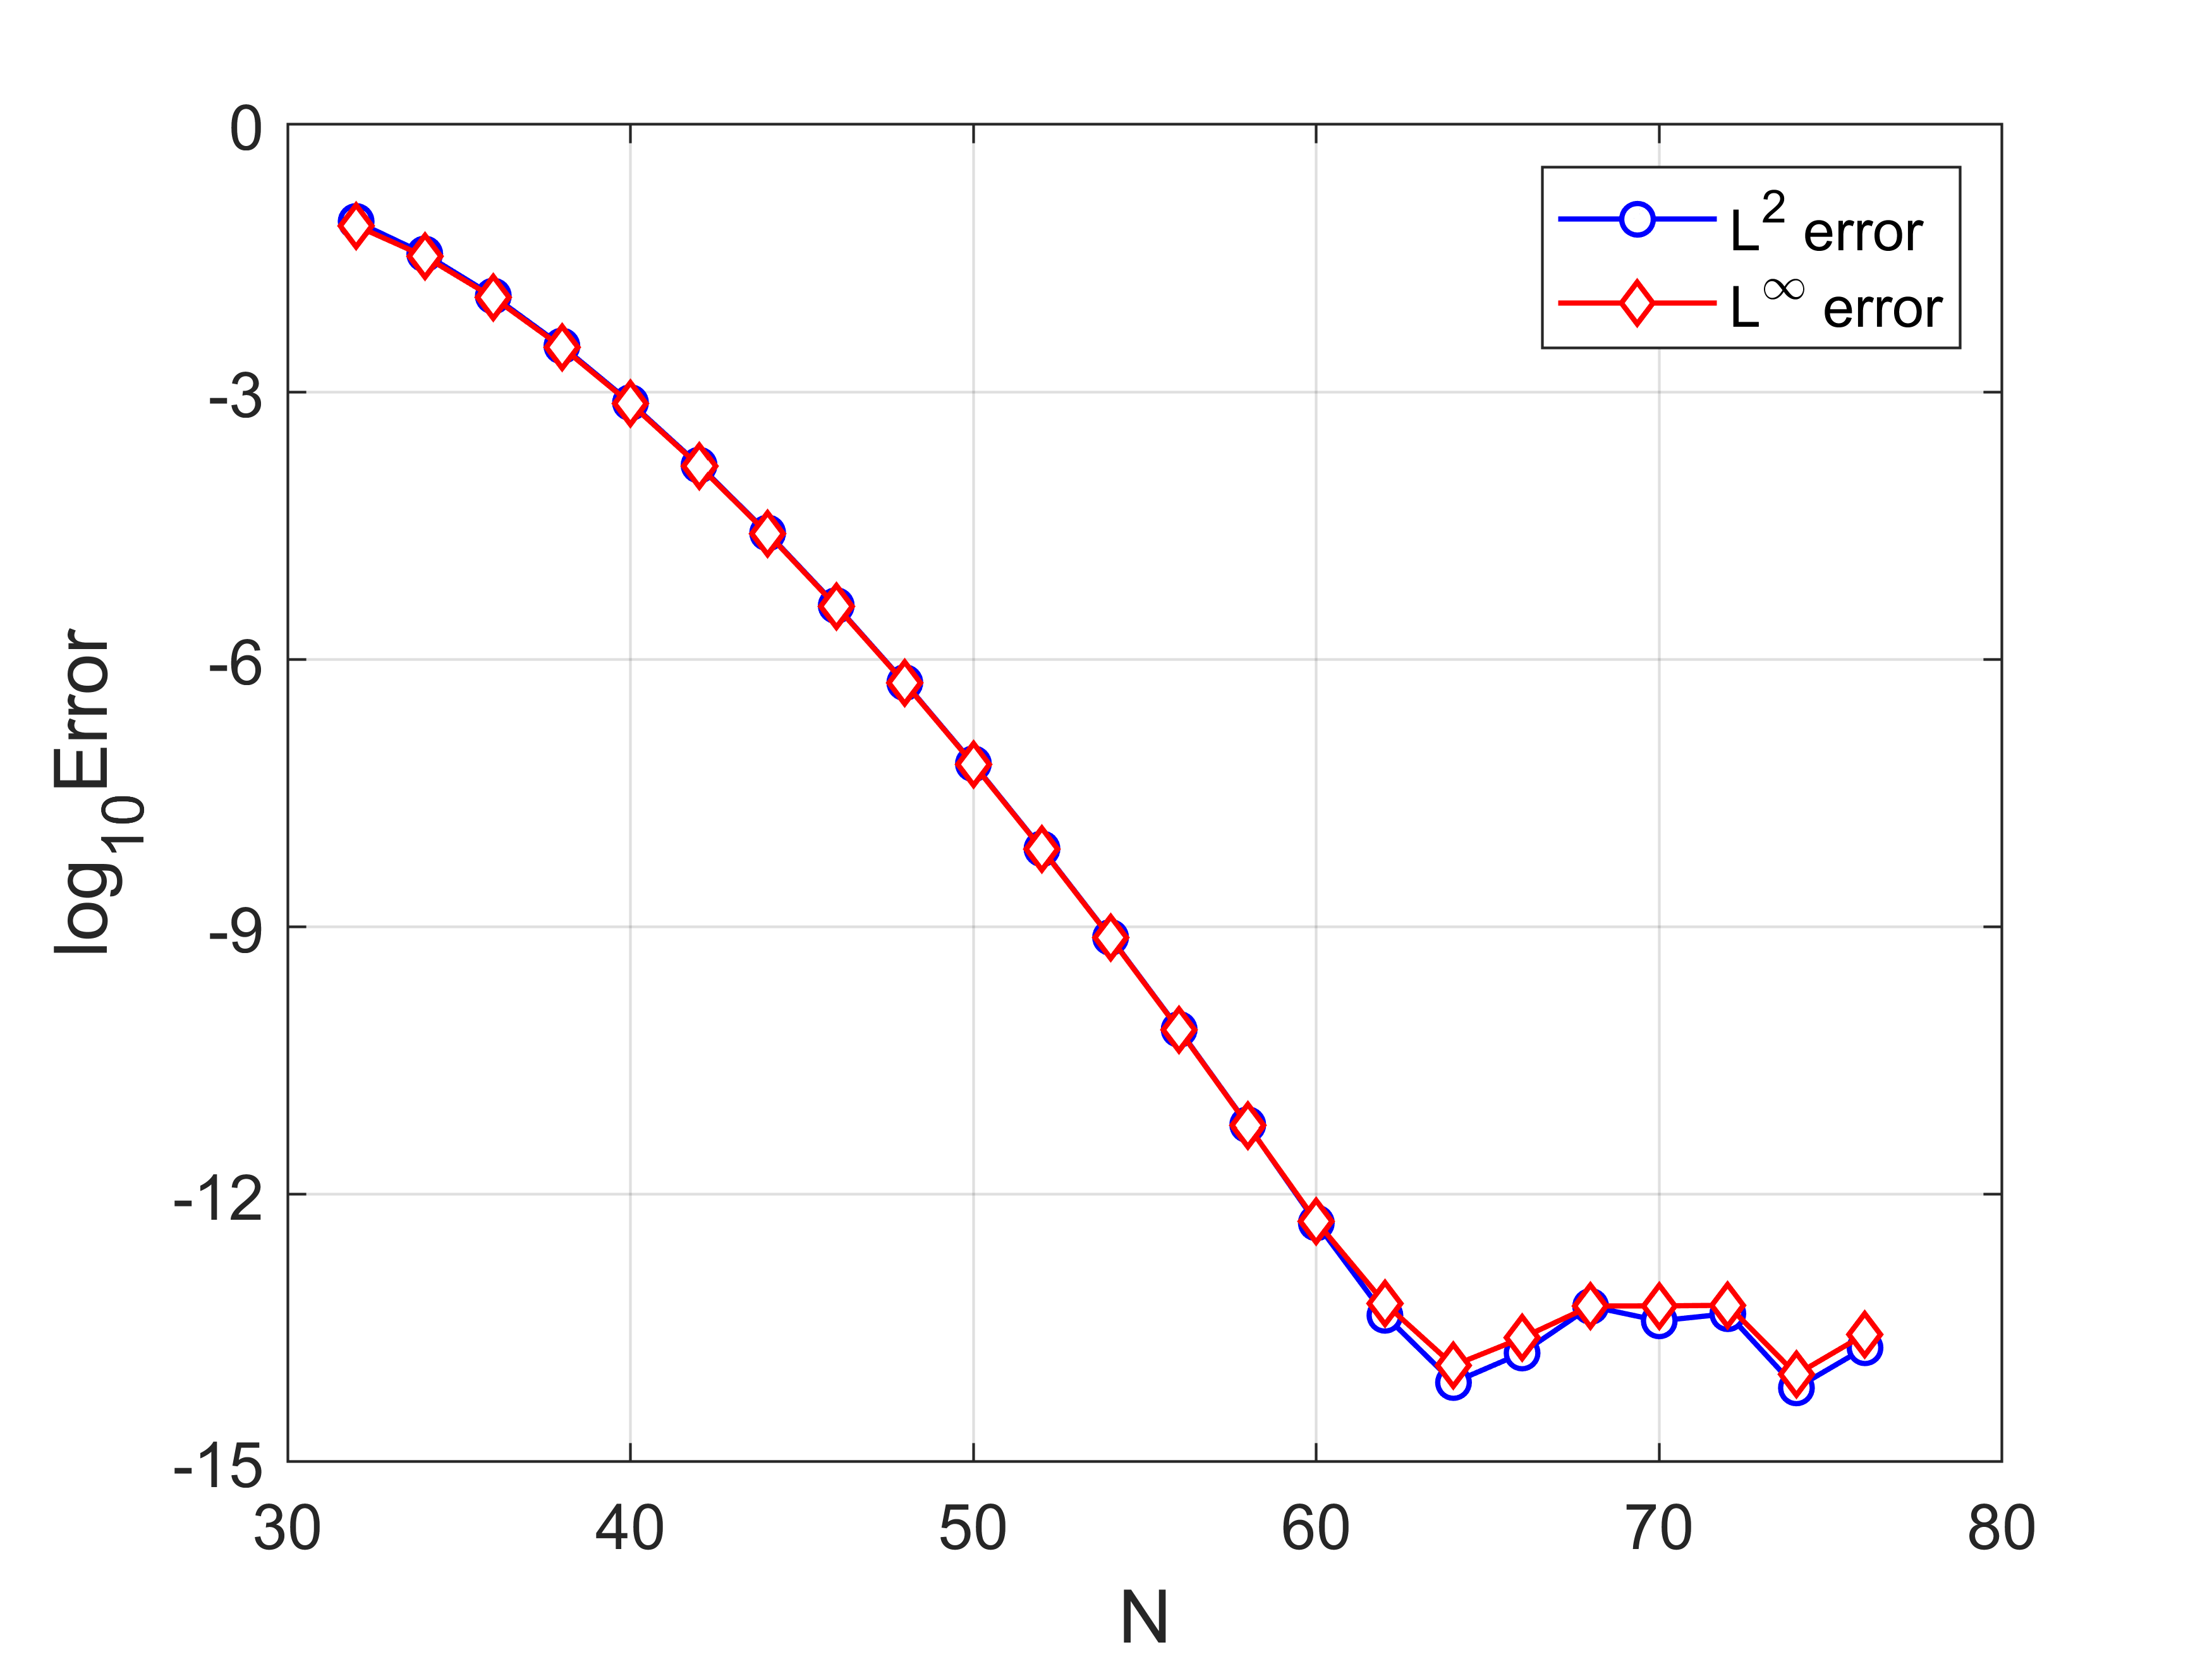
kw=10;
Nvec=[32:2:76];
L2_Err=[]; Max_Err=[];
for N=Nvec
[xv,wv]=legs(N+1);
Lm=lepolym(N,xv);
u=sin(kw*pi*xv);
f=kw*kw*pi^2*sin(kw*pi*xv)+sin(kw*pi*xv);
S=eye(N-1);
M=diag(1./(4*(0:N-2)+6))*diag(2./(2*(0:N-2)+1)+2./(2*(0:N-2)+5))...
-diag(2./(sqrt(4*(0:N-4)+6).*sqrt(4*(0:N-4)+14).*(2*(0:N-4)+5)),2)...
-diag(2./(sqrt(4*(2:N-2)-2).*sqrt(4*(2:N-2)+6).*(2*(2:N-2)+1)),-2);
A=S+M;
Pm=diag(1./sqrt(4*(0:N-2)+6))*(Lm(1:end-2,:)-Lm(3:end,:));
b=Pm*diag(wv)*f;
uh=A\b;
un=Pm'*uh;
L2_error=sqrt(((un-u).^2)'*wv);
Max_error=norm(abs(un-u),inf);
L2_Err=[L2_Err;L2_error];
Max_Err=[Max_Err;Max_error];
end
plot(Nvec,log10(L2_Err),'bo-','MarkerFaceColor','w','LineWidth',1)
hold on
plot(Nvec,log10(Max_Err),'rd-','MarkerFaceColor','w','LineWidth',1)
grid on
legend('L^2 error','L^{\infty} error','location','NorthEast')
set(gca,'fontsize',12)
xlabel('N','fontsize', 14), ylabel('log_{10}Error','fontsize',14)
xticks(30:10:80)
yticks(-15:3:0)
xlim([30 80])
ylim([-15 0])
|